hero_usage <- clean_season %>%
group_by(hero_name, hero_type, role) %>%
summarise(
total_duration_min = sum(duration, na.rm = TRUE),
total_duration_hours = round(sum(duration, na.rm = TRUE) / 60, 2),
.groups = "drop"
) %>%
arrange(desc(total_duration_min))
top_heroes <- hero_usage %>%
slice_max(order_by = total_duration_min, n = 10) %>%
mutate(hero_name = str_to_title(hero_name))
# ── Data ──────────────────────────────────────────────────────
max_hours_scalar <- max(top_heroes$total_duration_hours, na.rm = TRUE)
plot_df <- top_heroes %>%
left_join(
hero_polar %>% distinct(hero_name, image_url),
by = "hero_name"
) %>%
mutate(fraction = total_duration_hours / max_hours_scalar) %>%
arrange(desc(total_duration_hours))
hero_order <- plot_df$hero_name
# ── Portrait maker ────────────────────────────────────────────
SIZE <- 160L
role_colors_hex <- c(
"Duelist" = "#C58D12",
"Vanguard" = "#D55E00",
"Strategist" = "#5AA6D4")
make_composite_portrait <- function(image_url, fraction, role, hero_name) {
col <- role_colors_hex[[role]]
grey_rows <- max(0L, round((1 - fraction) * SIZE))
vis_rows <- SIZE - grey_rows
img <- tryCatch({
magick::image_read(image_url) %>%
magick::image_resize(paste0(SIZE, "x", SIZE, "!")) %>%
magick::image_convert(colorspace = "sRGB")
}, error = function(e) {
message(" ! Failed: ", hero_name)
magick::image_blank(SIZE, SIZE, color = col)
})
if (vis_rows <= 0L) {
composite <- magick::image_colorize(img, opacity = 85, color = "#2B3C43")
} else if (grey_rows <= 0L) {
composite <- img
} else {
full_grey <- magick::image_colorize(img, opacity = 85, color = "#2B3C43")
colour_strip <- magick::image_crop(img, paste0(SIZE, "x", vis_rows, "+0+0"))
composite <- magick::image_composite(full_grey, colour_strip,
operator = "Over", offset = "+0+0")
}
if (grey_rows > 3L && grey_rows < SIZE - 3L) {
divider <- magick::image_blank(SIZE, 4L, color = col)
composite <- magick::image_composite(composite, divider,
operator = "Over",
offset = paste0("+0+", grey_rows - 2L))
}
composite <- magick::image_extent(composite,
geometry = paste0(SIZE + 8L, "x", SIZE + 8L),
gravity = "Center", color = col)
tmp <- tempfile(fileext = ".png")
magick::image_write(composite, tmp, format = "png")
tmp
}
message("Generating portraits...")
plot_df <- plot_df %>%
rowwise() %>%
mutate(bubble_img = make_composite_portrait(image_url, fraction, role, hero_name)) %>%
ungroup()
message("Done.")
# ── Enable showtext (correct function name) ───────────────────
showtext_auto(enable = TRUE)
showtext_opts(dpi = 300)
# ── Role colours ──────────────────────────────────────────────
role_colors_hex <- c(
"Duelist" = "#C58D12",
"Vanguard" = "#D55E00",
"Strategist" = "#5AA6D4"
)
# ── Title & caption ───────────────────────────────────────────
github_icon <- "\uf09b"
github_username <- "marietolteca00"
title <- glue::glue(
"<span style='font-family:noto-sans; font-weight:bold;'>Most Used Hero Duration (Hours)</span>"
)
caption <- glue::glue(
"Data Source: \u00a92026 MARVEL<br>
<span style='font-family:fa-brands;'>{github_icon}</span> {github_username}"
)
# ── Plot ──────────────────────────────────────────────────────
max_h <- max_hours_scalar
duration <- ggplot(plot_df, aes(x = hero_name, y = total_duration_hours)) +
geom_image(
aes(image = bubble_img),
size = 0.07,
asp = 12 / 9
) +
# Hero name above the bubble — wrapped to avoid overflow
geom_text(
aes(y = total_duration_hours + 0.99,
label = stringr::str_wrap(hero_name, width = 10),
color = role),
family = "sarala",
size = 5.6,
fontface = "bold",
hjust = 0.5,
lineheight = 0.85
) +
# Hours label below the bubble
geom_text(
aes(y = total_duration_hours - 0.75,
label = sprintf("%.1fh", total_duration_hours),
color = role),
family = "red",
size = 5,
fontface = "bold"
) +
scale_color_manual(values = role_colors_hex, guide = "none") +
scale_x_discrete(limits = hero_order) +
scale_y_continuous(
limits = c(-1.0, max_h + 2.0),
breaks = seq(0, ceiling(max_h), by = 2),
expand = expansion(mult = c(0, 0))
) +
labs(
title = title,
subtitle = "Portrait fill shows Proportion of Max Playtime \u2022 Dark Grey = Unused Portion",
x = NULL,
y = NULL,
caption = caption
) +
theme_minimal(base_family = "noto-sans", base_size = 13) +
theme(
plot.background = element_rect(fill = "lightgrey", color = "#BCC7AA", linewidth = 3),
panel.background = element_rect(fill = "azure2"),
axis.text.x = element_blank(),
axis.text.y = element_blank(),
axis.title.x = element_blank(),
axis.title.y = element_blank(),
axis.ticks = element_blank(),
panel.grid.major.x = element_blank(),
panel.grid.major.y = element_line(color = "#cccccc80", linewidth = 0.4),
panel.grid.minor = element_blank(),
legend.position = "none",
plot.margin = margin(t = 0.5, r = 0.5, b = 0.5, l = 0.5, unit = "cm"),
# Title
plot.title = ggtext::element_markdown(
family = "noto-sans", face = "bold", size = 26,
hjust = 0.5, color = "#333333", margin = margin(b = 8)),
# Subtitle
plot.subtitle = element_text(
family = "sarala", hjust = 0.5, size = 15,
color = "#666666", margin = margin(b = 15)),
# Github and Data Source
plot.caption = ggtext::element_markdown(
family = "noto-sans", face = "italic", size = 10,
hjust = 1, margin = margin(t = 15), lineheight = 1.5, color = "#888888")
)
duration
showtext_auto(enable = FALSE)
# Kill/ Death Percent Ratio Hero Comparison
##| fig-width: 13
##| fig-height: 14
##| out-width: "100%"
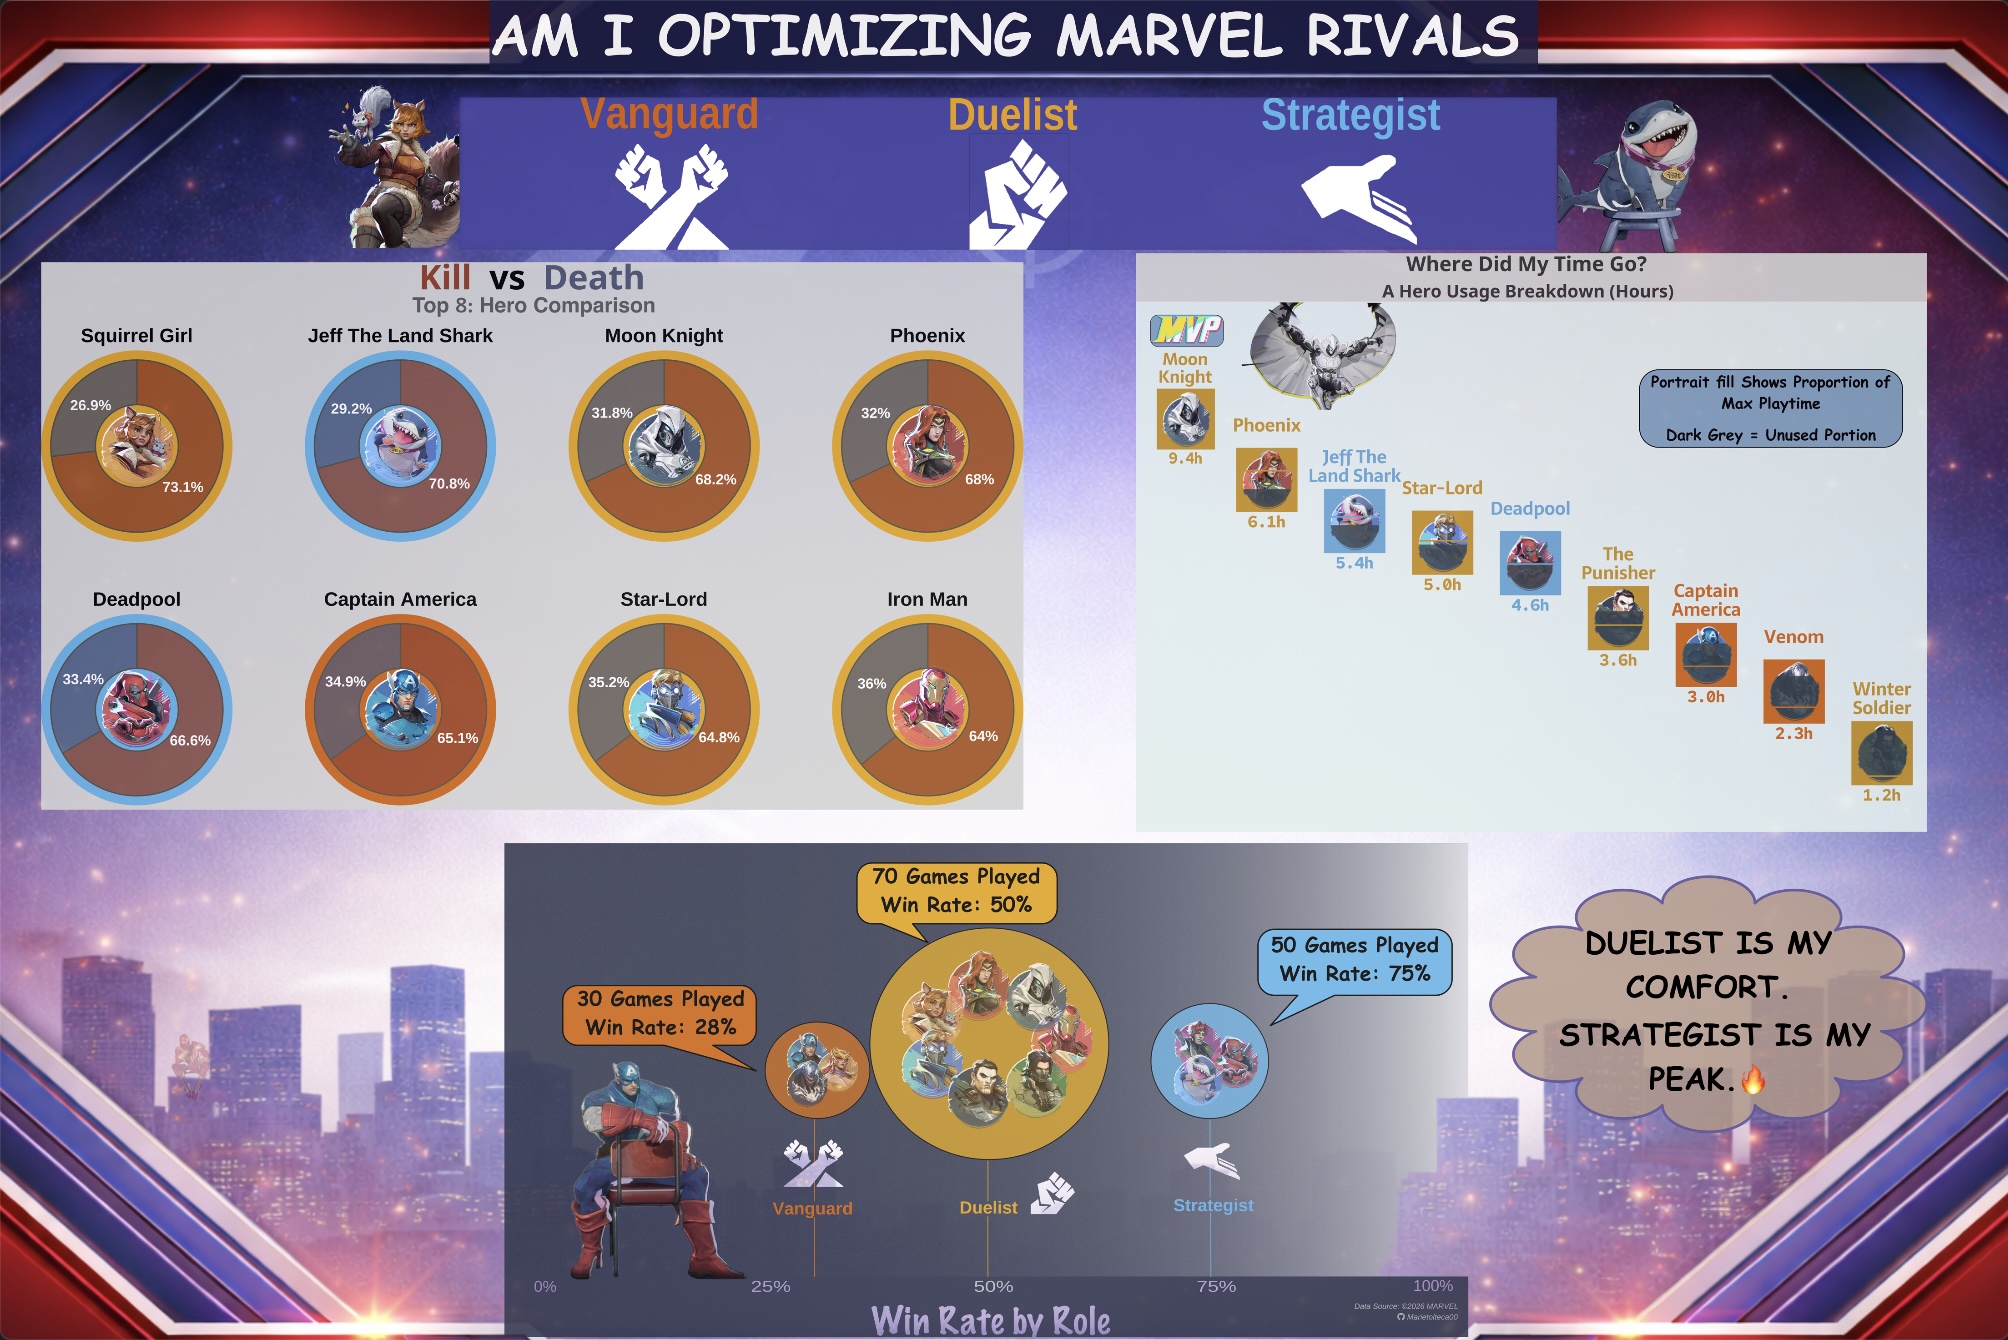
##| fig-alt: "Grid of donut charts comparing the percentage of kills versus deaths for multiple heroes across Duelist, Strategist, and Vanguard roles. Most heroes show a higher percentage of kills than deaths. Duelists such as Squirrel Girl, Moon Knight, Iron Man, Phoenix, and Star-Lord have kill percentages between roughly 64–73%. Strategists and Vanguards show slightly more balanced ratios, with heroes like Winter Soldier and The Punisher close to 50/50."
##| fig-cap: "Kill to death ratios across heroes. Donut charts show the proportion of kills (orange) and deaths (gray) for each hero. Most heroes achieve more kills than deaths, particularly Duelists who are designed for damage output. Some characters such as Winter Soldier and The Punisher have more balanced ratios, suggesting higher risk or frontline engagement during matches."
#showtext.auto(enable = TRUE)
title <- glue::glue("<span style='color:#99381E;'>Kill</span>
<span style='color:#000000;'>vs</span>
<span style='color:#4E5472;'>Death</span>
<span style='color:#000000;'>Hero Comparison</span>")
github_icon <- "\uf09b"
github_username <- "Marietolteca00"
caption <- glue::glue(
"Data Source: ©2026 MARVEL <br>
<span style='font-family:fa-brands;'>{github_icon}</span>
{github_username}"
)
#.........................data prep.........................
hero_polar <- hero_kd_summary %>%
# Remove Angela
filter(str_to_title(hero_name) != "Angela") %>%
mutate(
hero_name = str_to_title(hero_name),
death_ratio = avg_deaths / (avg_kills + avg_deaths),
hero_name = fct_reorder(hero_name, death_ratio, .desc = FALSE),
role_color = case_when(
role == "Duelist" ~ "#E69F00",
role == "Strategist" ~ "#56B4E9",
role == "Vanguard" ~ "#D55E00"
)
) %>%
select(hero_name, avg_kills, avg_deaths, role, role_color, image_url) %>%
pivot_longer(cols = c(avg_kills, avg_deaths),
names_to = "stat", values_to = "value") %>%
mutate(stat_label = ifelse(stat == "avg_kills", "Kills", "Deaths")) %>%
group_by(hero_name) %>%
mutate(
pct = value / sum(value),
y_pos = cumsum(pct) - 0.5 * pct
)
# Recreate bg_data AFTER filtering
bg_data <- hero_polar %>%
distinct(hero_name, role_color)
#.........................plot.........................
kd_plot1 <- hero_polar %>%
ggplot() +
geom_rect(
data = bg_data,
aes(fill = role_color),
xmin = -Inf, xmax = Inf, ymin = -Inf, ymax = Inf
) +
scale_fill_identity() +
# Images for Heroes
geom_from_path(
data = hero_polar %>% distinct(hero_name, .keep_all = TRUE),
aes(x = 0, y = 0, path = image_url),
width = 0.36,
vjust = 0.54
) +
# Size of Columns
geom_col(
aes(x = 5, y = pct,
fill = ifelse(stat_label == "Kills", "#99381E", "#4E5472")),
width = 4.2, alpha = 0.8,
color = "#4D4E40", linewidth = 0.6 # outline
) +
# Percent Ratios
geom_text(
data = . %>% filter(value > 0),
aes(x = 4.8, y = y_pos, label = paste0(round(pct * 100, 1), "%")),
size = 4.5, fontface = "bold", color = "black"
) +
geom_text(
data = hero_polar %>% distinct(hero_name, role, .keep_all = TRUE),
aes(x = 0, y = 0, label = hero_name),
color = "black", size = 6, fontface = "bold", vjust = -7
) +
facet_wrap(~hero_name, ncol = 4) +
scale_fill_identity() +
coord_polar("y") +
# Background of heroes
xlim(-1, 8) +
labs(title = title, caption = caption) +
theme_void() +
theme(
plot.background = element_rect(fill = "lightgrey", color = "aliceblue", linewidth = 3),
panel.background = element_blank(),
strip.text = element_blank(),
strip.background = element_blank(),
legend.position = "none",
plot.margin = margin(t = 0.5, r = 0.5, b = 0.5, l = 0.5, unit = "cm"),
panel.spacing = unit(1.5, "lines"),
plot.title = ggtext::element_markdown(
family = "noto-sans", face = "bold", size = 25,
hjust = 0.5, color = "#ACAB97", margin = margin(b = 10)
),
plot.caption = ggtext::element_markdown(
face = "italic", size = 12, margin = margin(t = 15), lineheight = 1.5
)
)
kd_plot1
#showtext.auto(enable = FALSE)
# Win Rate Plot
### Edits Were made on Affinity
##| fig-alt: "Bubble chart showing win rate across three roles: Vanguard, Duelist, and Strategist. Bubble size represents the number of games played. Strategists appear to have the highest win rate (around the mid-70% range), Duelists show moderate win rates around 50%, and Vanguards have lower win rates near 30%."
##| fig-cap: "Win rate differences across roles. The chart compares average win rate for Vanguard, Duelist, and Strategist roles, with bubble size representing the number of matches played. Strategists show the highest win rates, while Duelists have moderate success and Vanguards show lower win rates overall. These patterns suggest that team support roles may have stronger influence on match outcomes."
# Edits were made on Affinity
#knitr::include_graphics(here::here("blog_post","MarvelRivals_post","NEW_WIN_RATE.png"))
# Data Wrangle
max_games <- max(role_stats$games)
radius_scale <- 0.06 # tweak this to change overall circle sizes
role_stats4 <- role_stats %>%
group_by(role) %>%
mutate(
hero_index = row_number(),
n_heroes = n(),
r = games / max_games * radius_scale,
angle = 2 * pi * (hero_index - 1) / n_heroes,
# position images at ~60% of radius so they stay inside the circle
image_x = win_rate + (r * 0.6) * cos(angle),
image_y = 1 + (r * 0.6) * sin(angle)
) %>%
ungroup()
size_range <- c(20, 60)
max_games <- max(role_stats4$games)
# Plot dimensions to correct aspect ratio
x_range <- 1 # 0 to 1 (0% to 100%)
y_range <- 0.4 # approximate y range visible in plot
role_stats4 <- role_stats4 %>%
group_by(role) %>%
mutate(
pt_size = size_range[1] + (games / max_games) * (size_range[2] - size_range[1]),
r = pt_size * 0.0008,
angle = 2 * pi * (hero_index - 1) / n_heroes,
image_x = win_rate + r * cos(angle),
image_y = 1 + (r * (x_range / y_range) * 0.15) * sin(angle)
) %>%
ungroup()
#..........................create title..........................
title <- glue::glue("<span style='color:#000000;'>Win</span>
<span style='color:#000000;'>Rate</span>
<span style='color:#ACAB97;'>by</span>
<span style='color:#000000;'>Role</span>")
#.........................create caption.........................
github_icon <- "\uf09b"
github_username <- "marietolteca00"
caption <- glue::glue(
"Data Source: ©2026 MARVEL <br>
<span style='font-family:fa-brands;'>{github_icon}</span>
{github_username}"
)
# Plot
win_rate <- ggplot(role_stats4 %>% distinct(role, win_rate, games), aes(x = win_rate, y = 1)) +
# black to dark red Marvel gradient
annotation_custom(
grid::rasterGrob(
matrix(c("#0a0a0a", "#1a0a0a", "#2d0a0a", "#8b0000"), nrow = 1),
width = unit(1, "npc"), height = unit(1, "npc"),
interpolate = TRUE
),
xmin = -Inf, xmax = Inf, ymin = -Inf, ymax = Inf
) +
geom_point(aes(size = games, fill = role), shape = 21, alpha = 0.8) +
geom_image(
data = role_stats4,
aes(x = image_x, y = image_y, image = image_url),
size = 0.080
) +
# role label below each bubble
geom_text(
data = role_stats4 %>% distinct(role, win_rate, games),
aes(x = win_rate, y = 0.91, label = role, color = role),
fontface = "bold", size = 4.5
) +
scale_size_continuous(range = size_range) +
scale_fill_manual(values = c(
"Duelist" = "#E69F00", # orange
"Strategist" = "#56B4E9", # sky blue
"Vanguard" = "#D55E00" # vermillion
)) +
scale_color_manual(values = c(
"Duelist" = "#E69F00",
"Strategist" = "#56B4E9",
"Vanguard" = "#D55E00"
))+
scale_x_continuous(labels = scales::percent, limits = c(0, 1)) +
scale_y_continuous(limits = c(0.88, 1.15)) +
labs(
title = title,
subtitle = "Bubble size represents games played",
x = "Win Rate",
y = "",
caption = caption,
size = "Games Played"
) +
theme_void() +
theme(
plot.background = element_rect(fill = "#343A51", color = "#8b0000", linewidth = 4),
panel.background = element_rect(fill = NA),
# subtle red-tinted gridlines
panel.grid.major.x = element_line(color = "#3d0000", linewidth = 0.4, linetype = "dashed"),
panel.grid.minor.x = element_line(color = "#1f0000", linewidth = 0.2, linetype = "dotted"),
# x-axis in silver/white
axis.text.x = element_text(size = 15, color = "#c0c0c0", margin = margin(t = 8)),
axis.ticks.x = element_line(color = "#c0c0c0", size = 2, margin = margin(t=8)),
axis.title.x = element_text(size = 15, color = "#ffffff", face = "bold", margin = margin(t = 8)),
axis.text.y = element_blank(),
axis.ticks.y = element_blank(),
panel.grid.major.y = element_blank(),
# legend in silver/white
legend.title = element_text(size = 12, face = "bold", color = "#ffffff"),
legend.text = element_text(size = 12, color = "#ffffff"),
legend.position = "top",
plot.title = ggtext::element_markdown(
family = "noto-sans", face = "bold", size = 30,
hjust = 0.5, color = "#ffffff", margin = margin(b = 5, t=15)),
plot.subtitle = ggtext::element_markdown(
size = 18, hjust = 0.5, color = "#c0c0c0",
family = "bold.italic",
margin = margin(b = 10)),
plot.caption = ggtext::element_markdown(
face = "italic", size = 10, color = "#c0c0c0",
margin = margin(t = 5), lineheight = 1.5, hjust = 0.98)
) +
guides(
fill = "none",
color = "none",
size = guide_legend(override.aes = list(
size = c(2, 4, 6),
color = "white" # legend circle outlines in white
))
)
win_rate